Refining Filter Design in Kaytu SaaS Dashboard
I joined Kaytu in 2023 during its early stages and meticulously designed each feature step by step, ultimately creating a competitive web app. Over time, I expanded the design team to three designers. I worked on this project for over 10 months, and I’d like to share our process for refining filter design.
Context
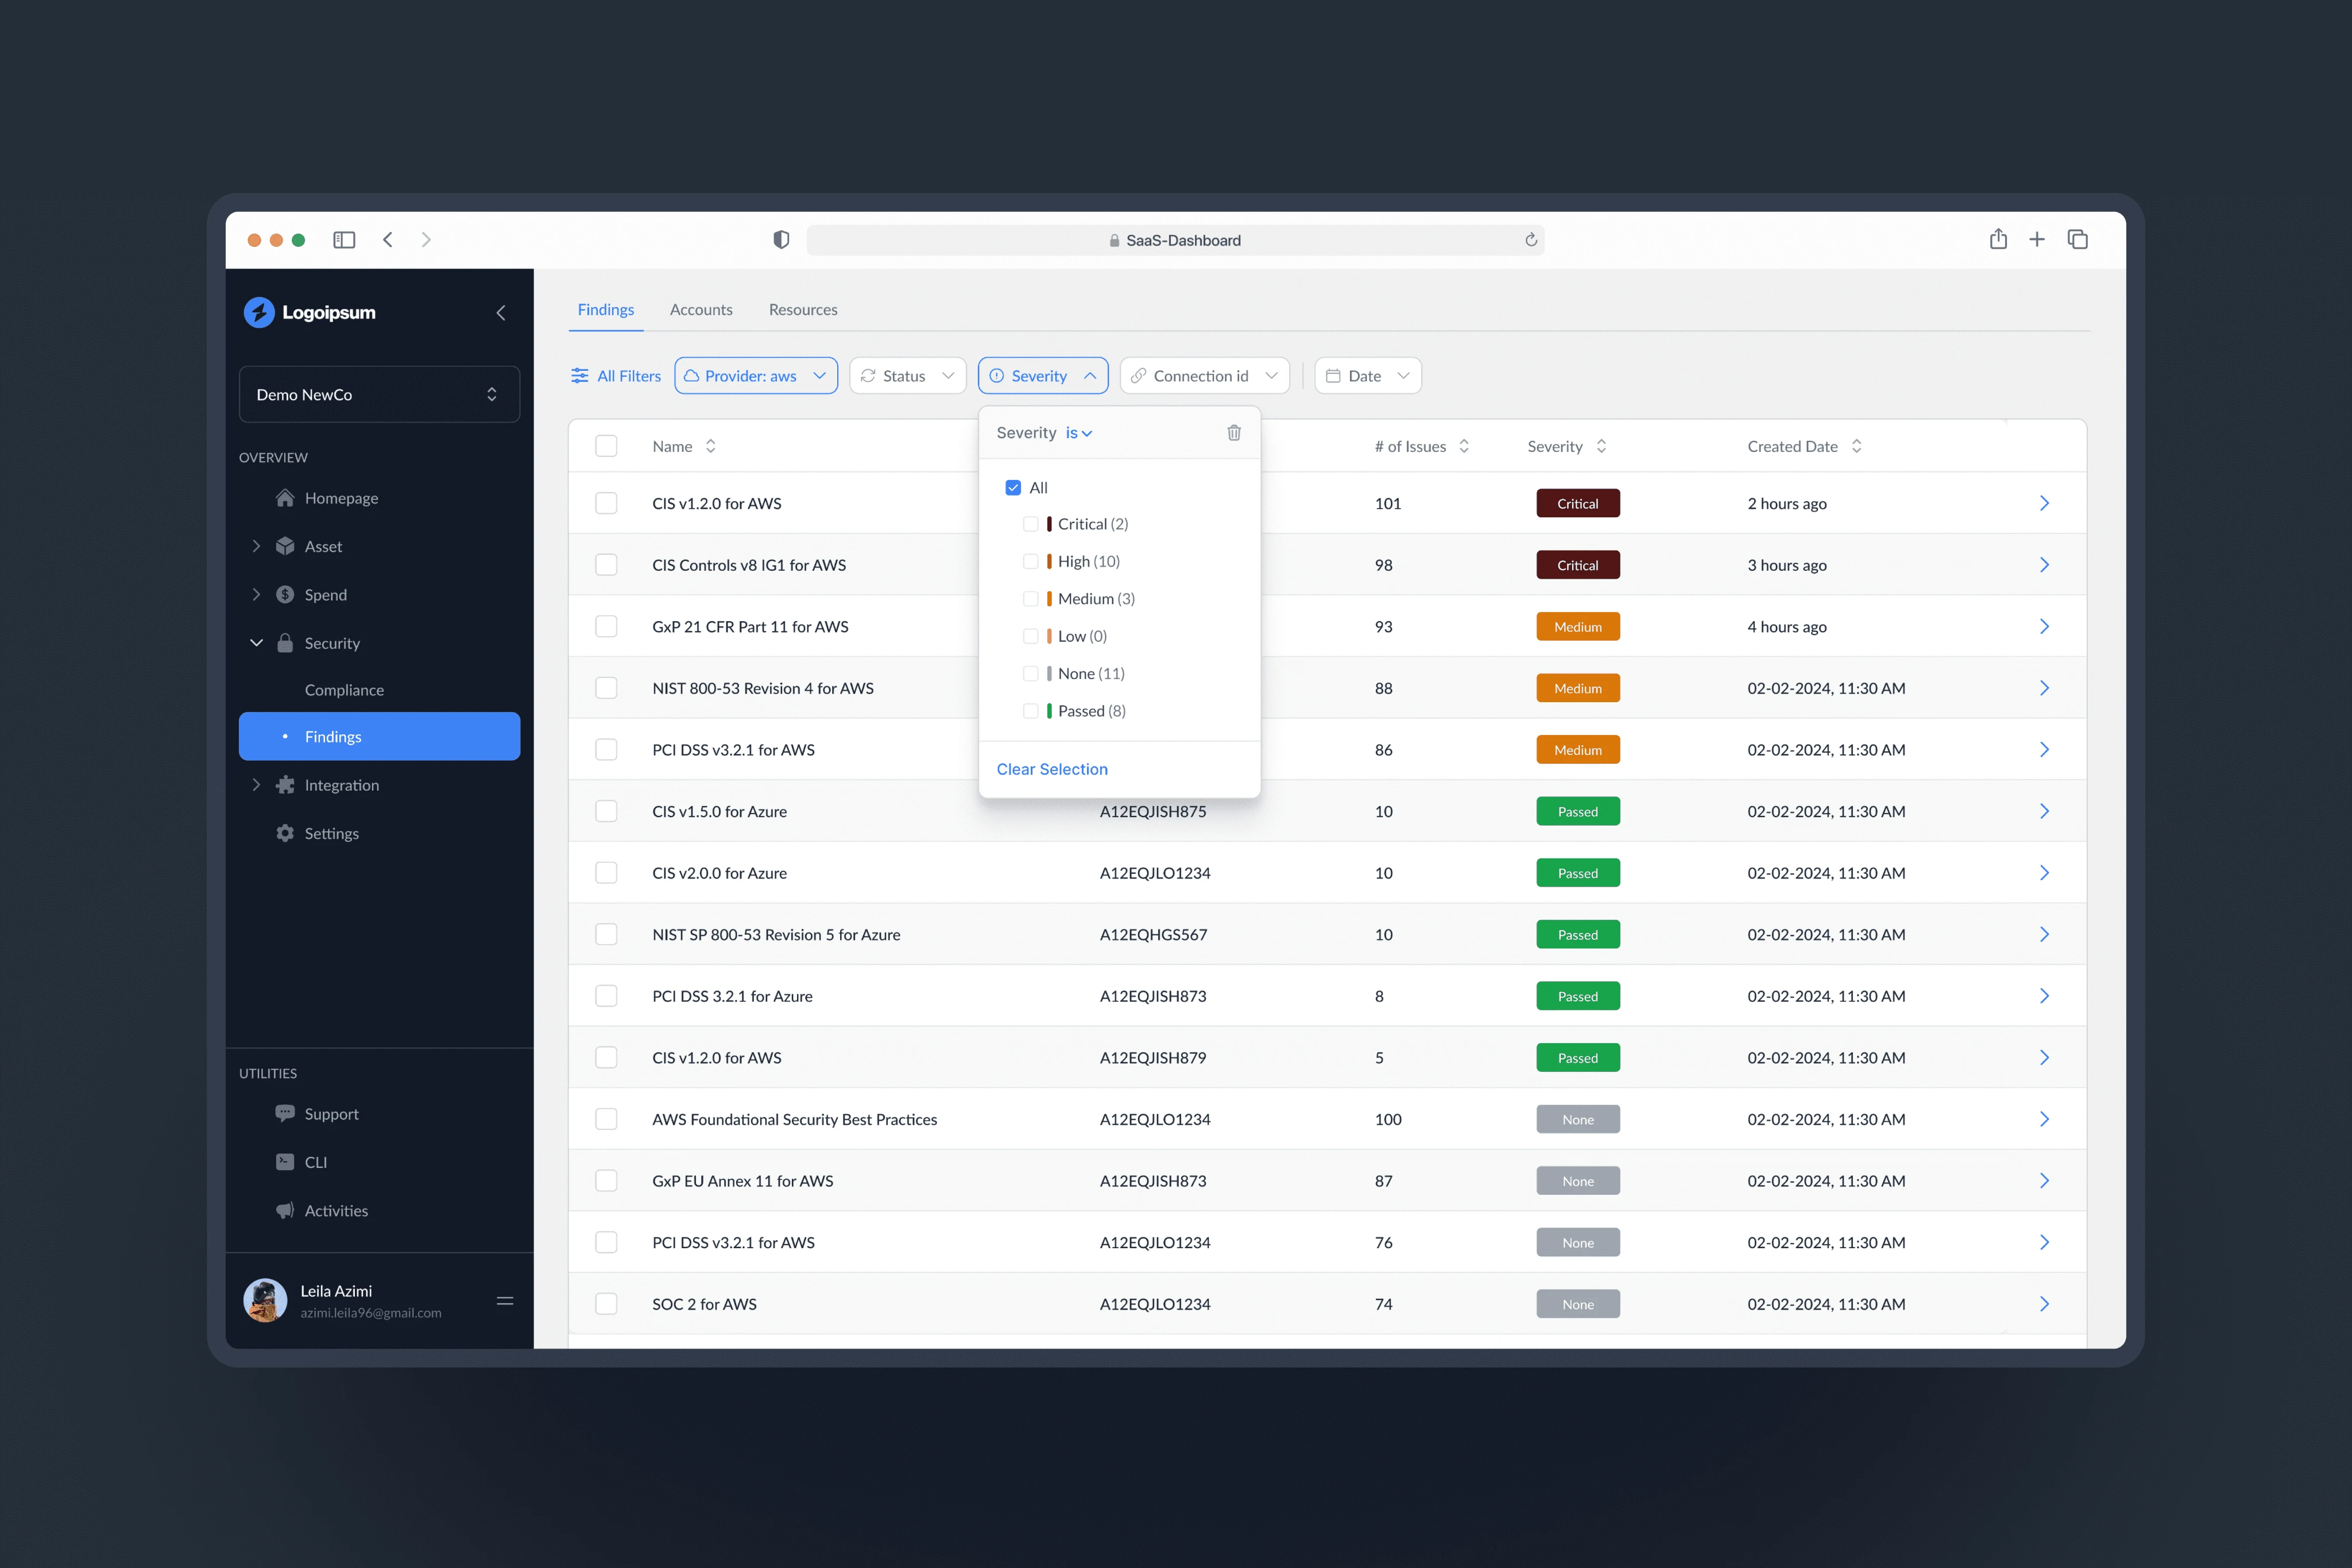
A cloud management dashboard provides a centralized platform for monitoring and managing various aspects of cloud infrastructure and applications. Within this dashboard, heavy load tables play a pivotal role, aiding users in pinpointing specific data. By refining and optimizing filters, not only does performance soar, but the overall user experience elevates significantly.
Problem Statement
- A confusing filtering system can leave users unsure how to use the tool effectively.
- A low click rate on filters within tables indicates usability issues, such as challenges in locating relevant filter criteria.
Process
- Conducting user interviews to understand the existing pain points
- Defining better success metrics with key stakeholders for the tool
- Competitive analysis
- Brainstorming workshops
- Prioritization of the ideas
- Design iterations & testing

User Interviews
Existing Pains:
- Filter Discovery Challenges:Users struggle to efficiently locate and select relevant filters within our dashboard interface, leading to prolonged search times and reduced productivity.
- Filter Bypass Behavior:Users opt to navigate to alternative dashboards to retrieve unique identifiers, bypassing our filtering system entirely. This indicates a lack of confidence or awareness in the effectiveness of our dashboard filters for data retrieval.
- Low Awareness of Filtering Capabilities:Some users are unaware of the filtering functionality available within our dashboard, resulting in missed opportunities to efficiently locate specific data points. This points to a need for improved communication and education regarding the filtering features offered.
Benefits:
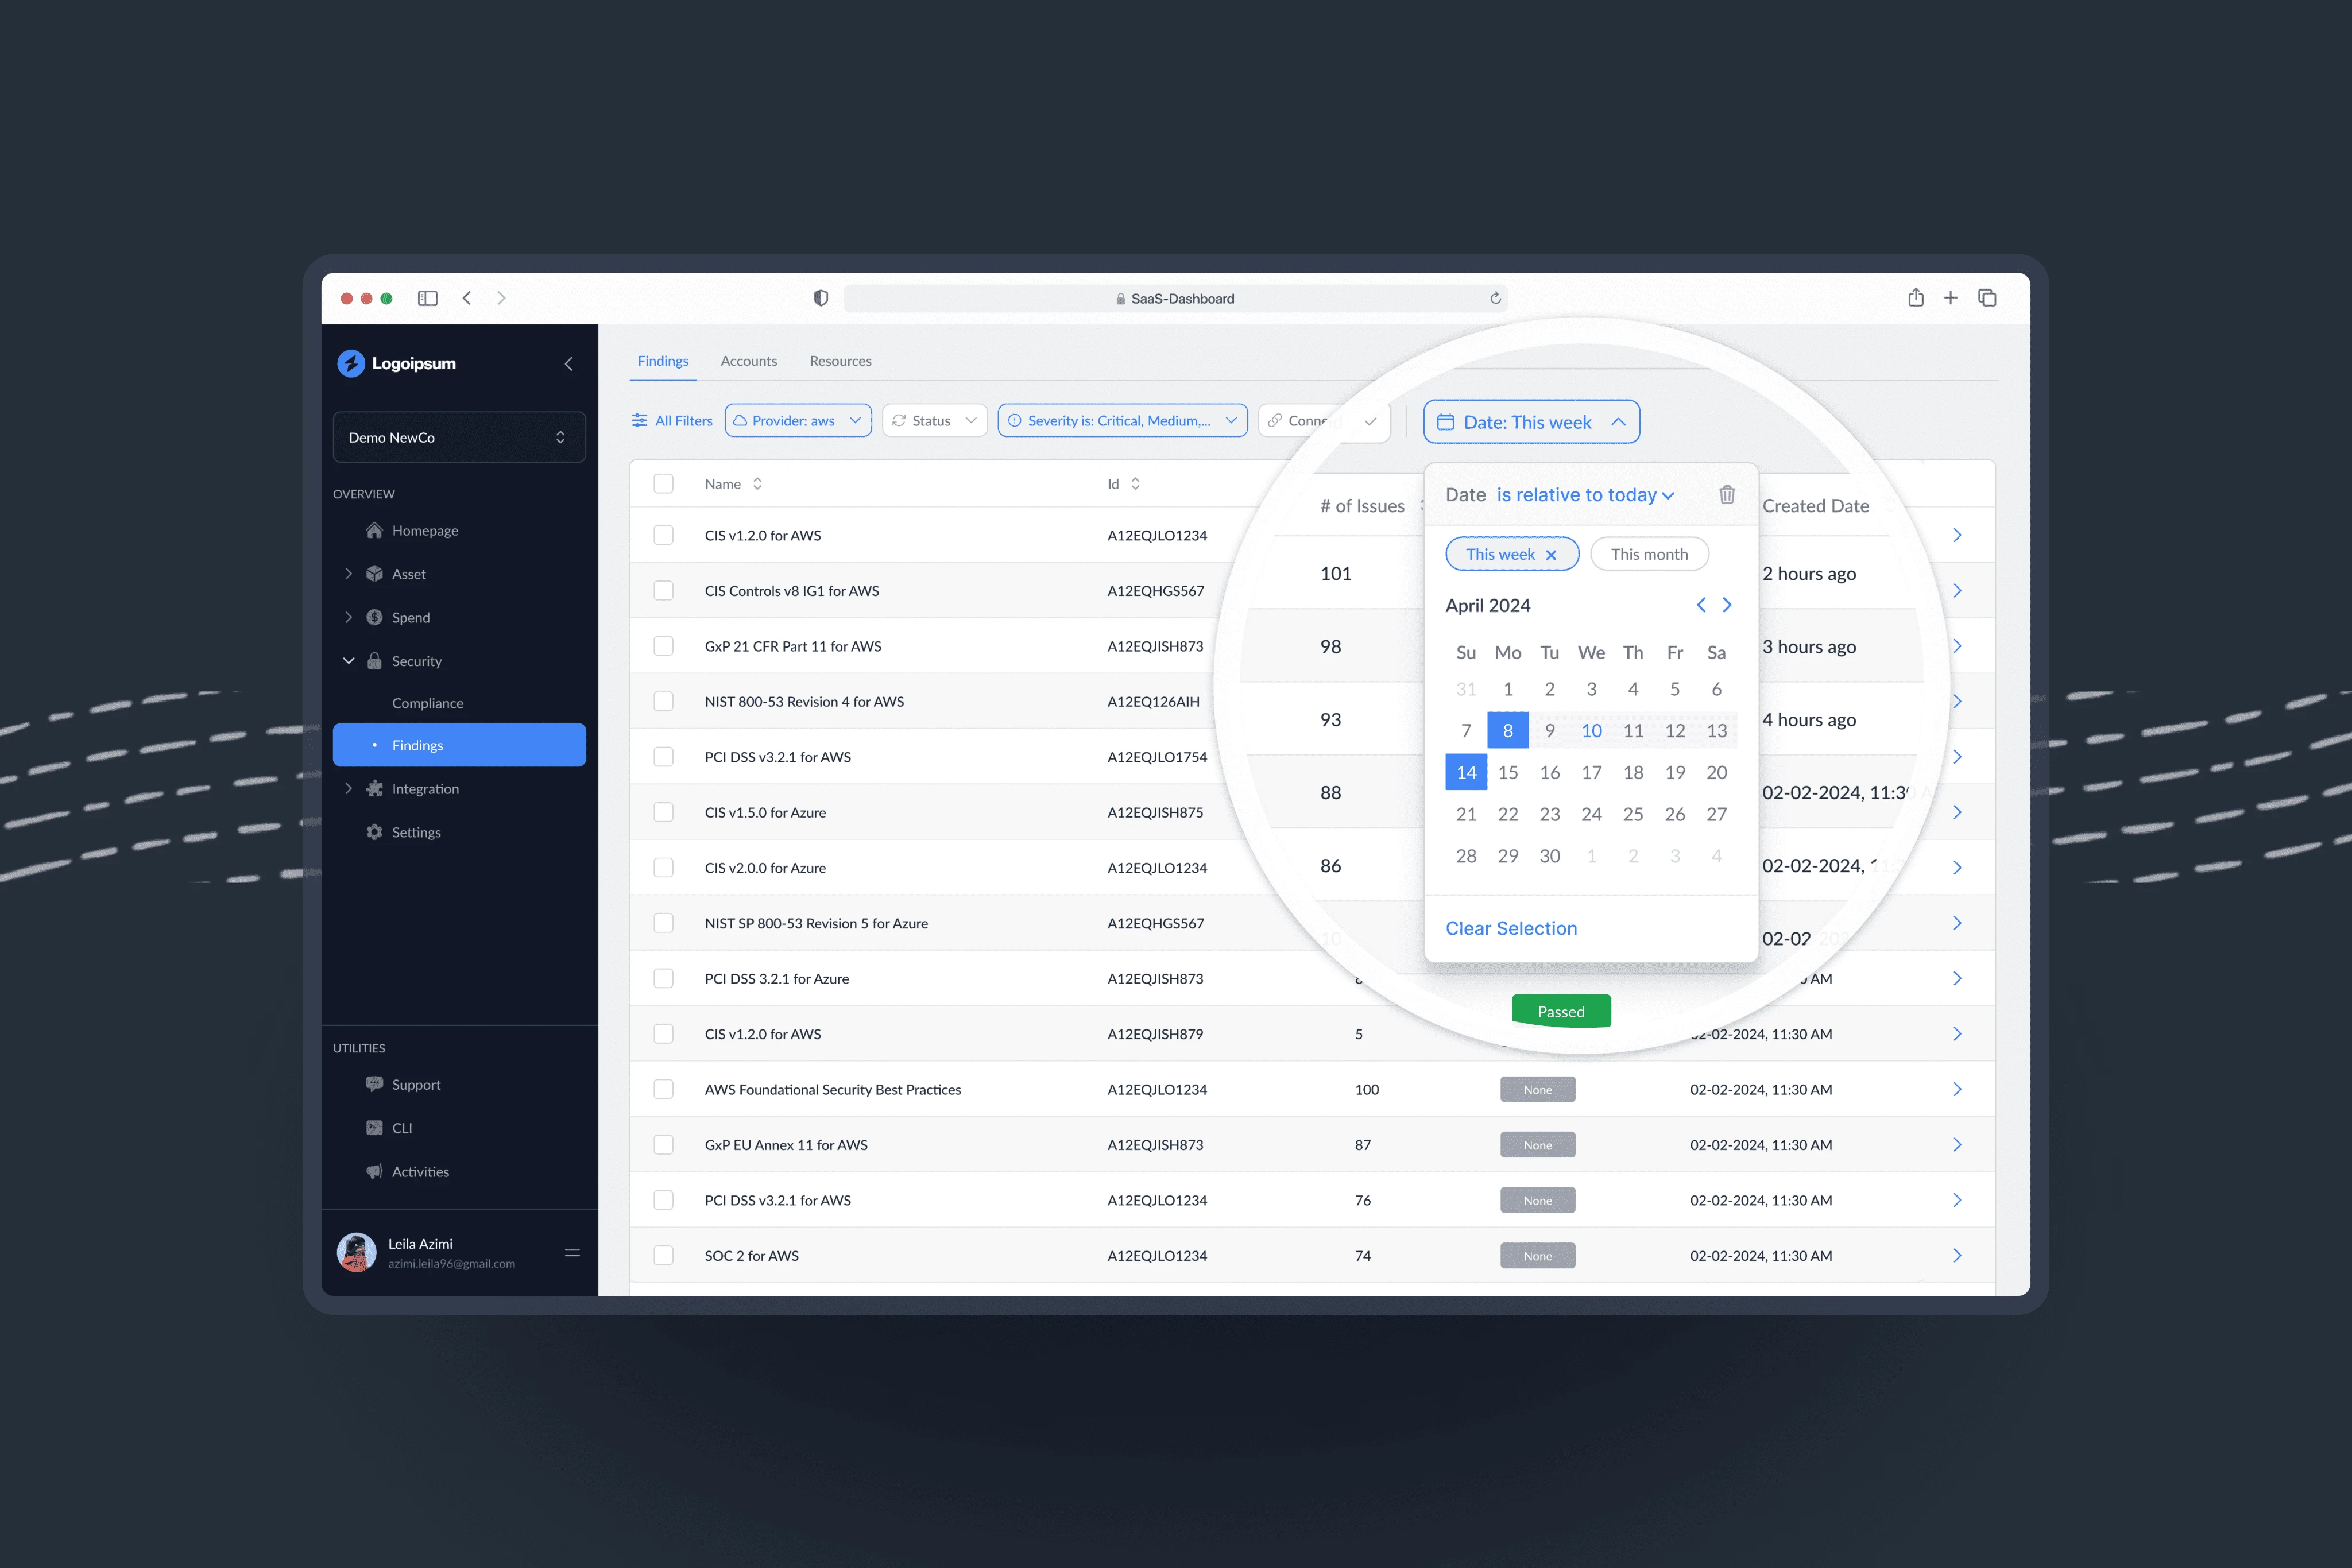
- Rapid Responsiveness:Our dashboard operates swiftly, seamlessly adjusting to new filter selections made by users without any delay. This ensures a smooth and uninterrupted data exploration experience, enhancing user efficiency and satisfaction.
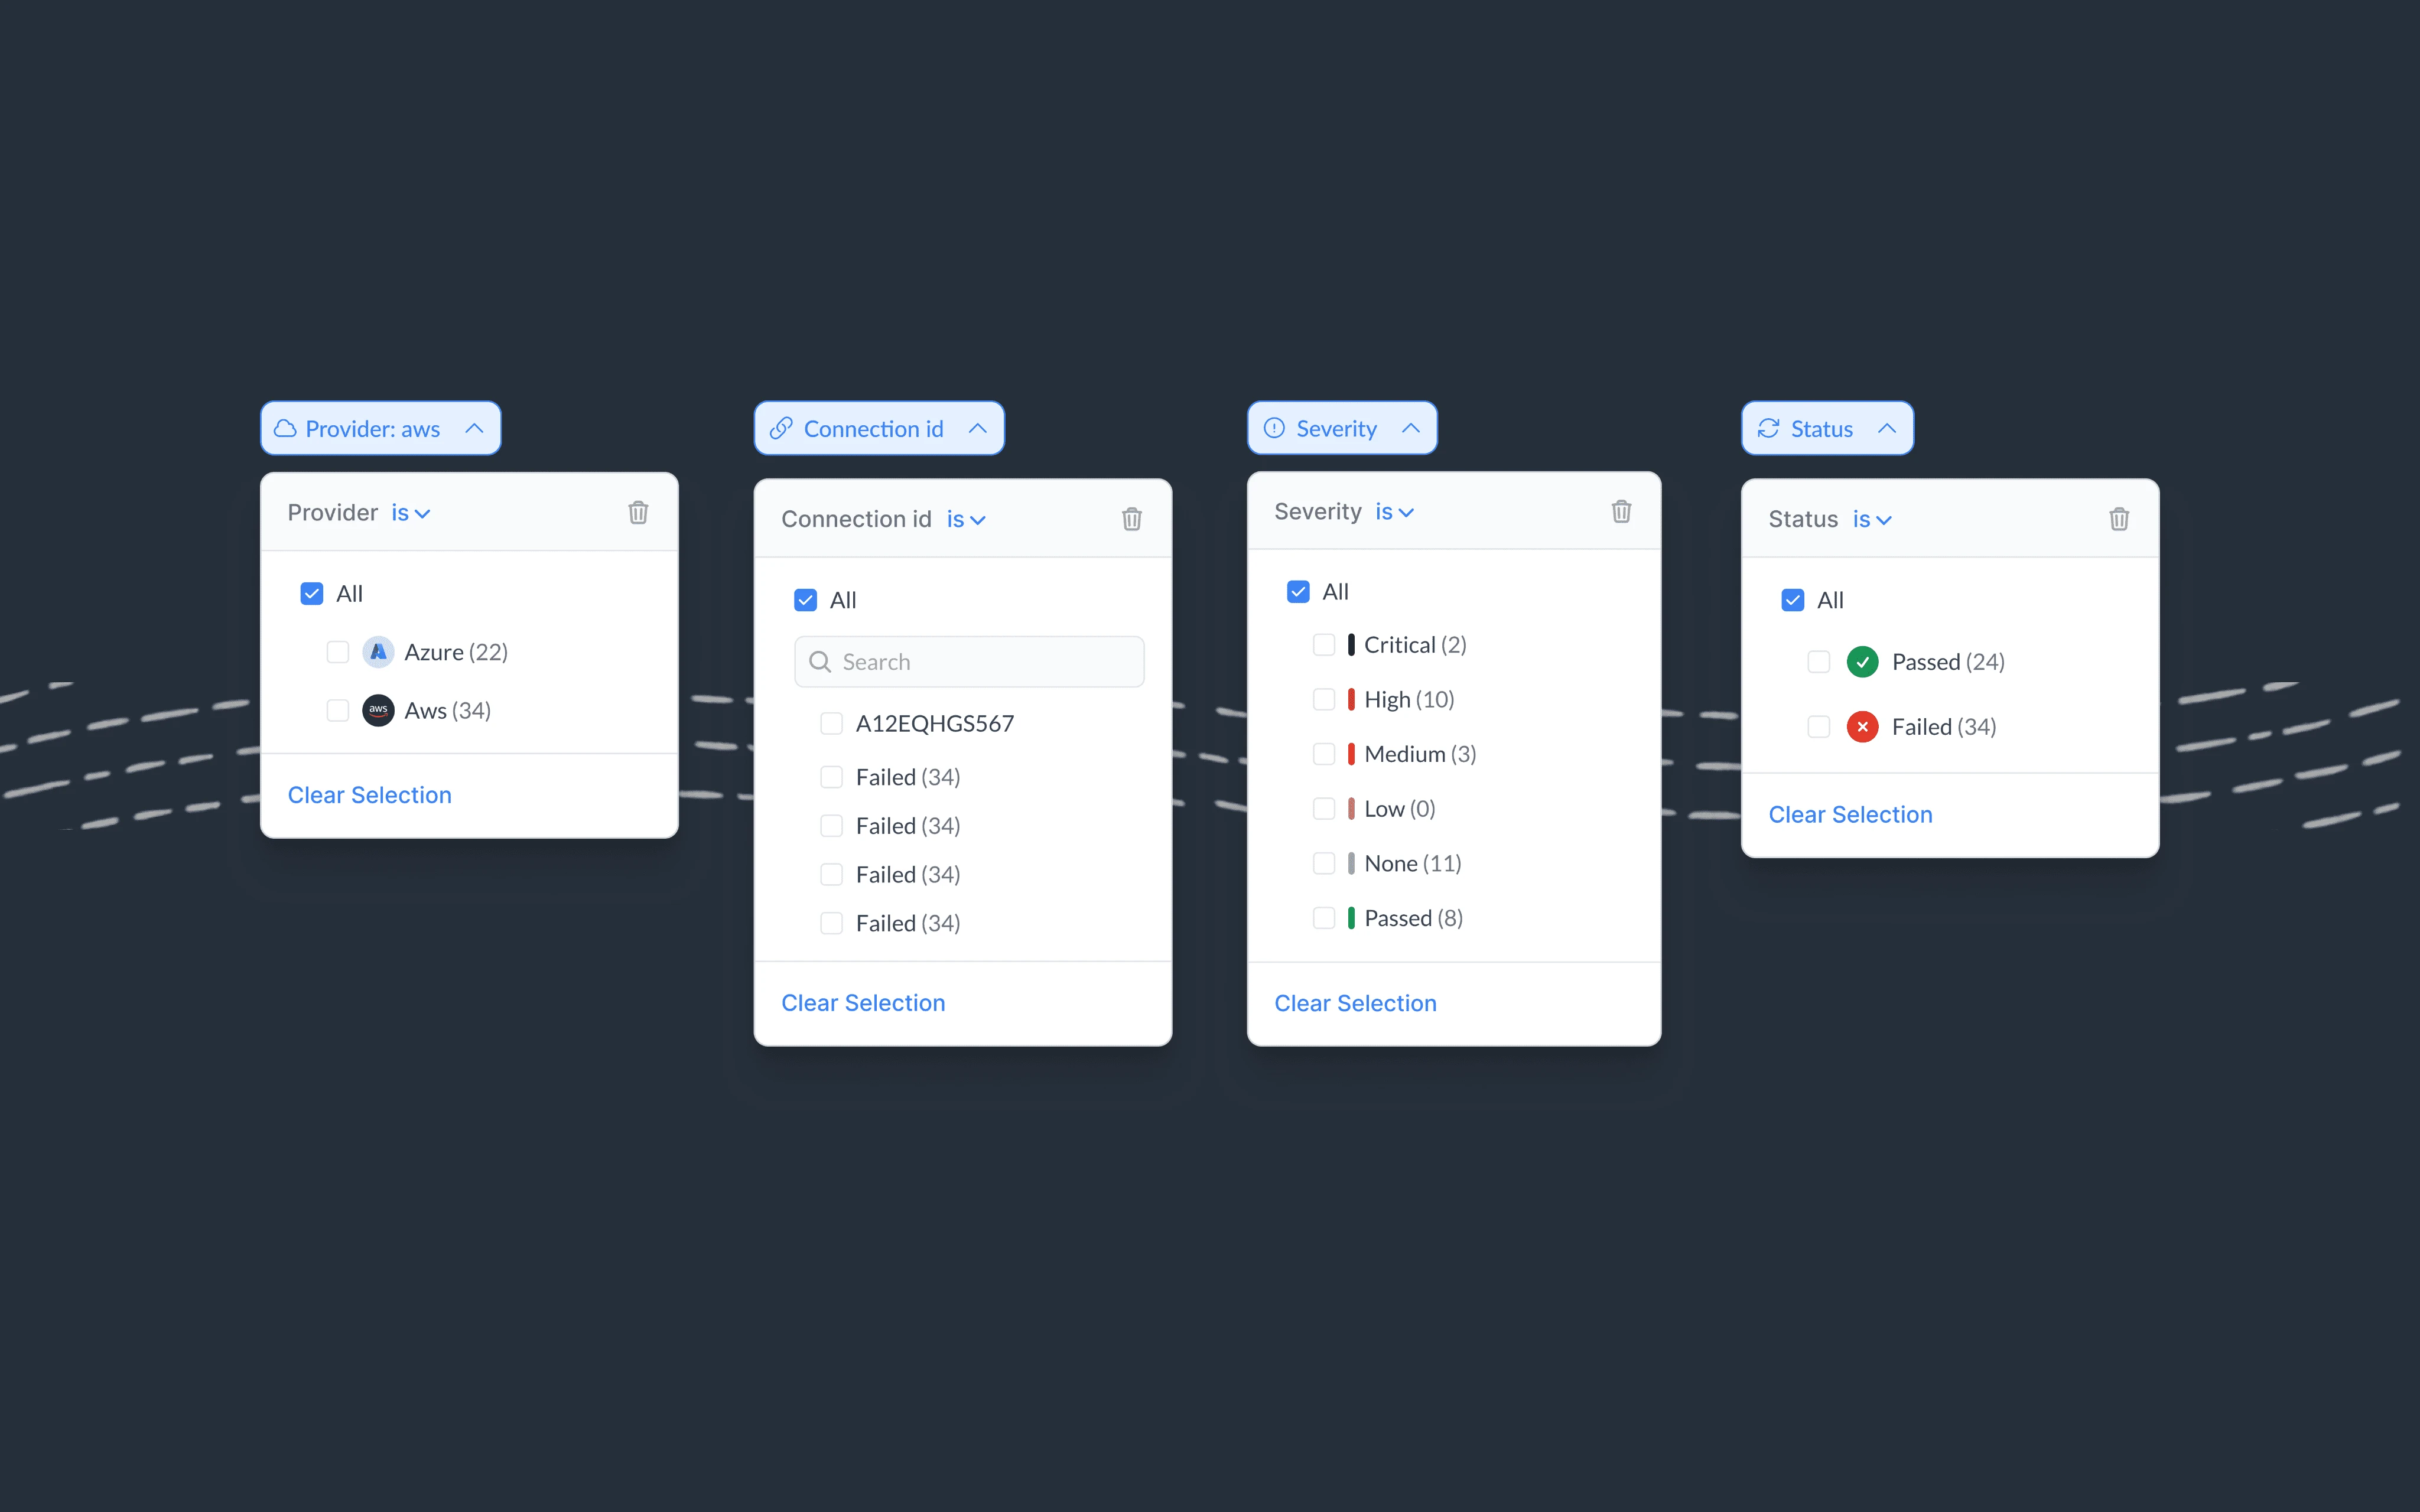
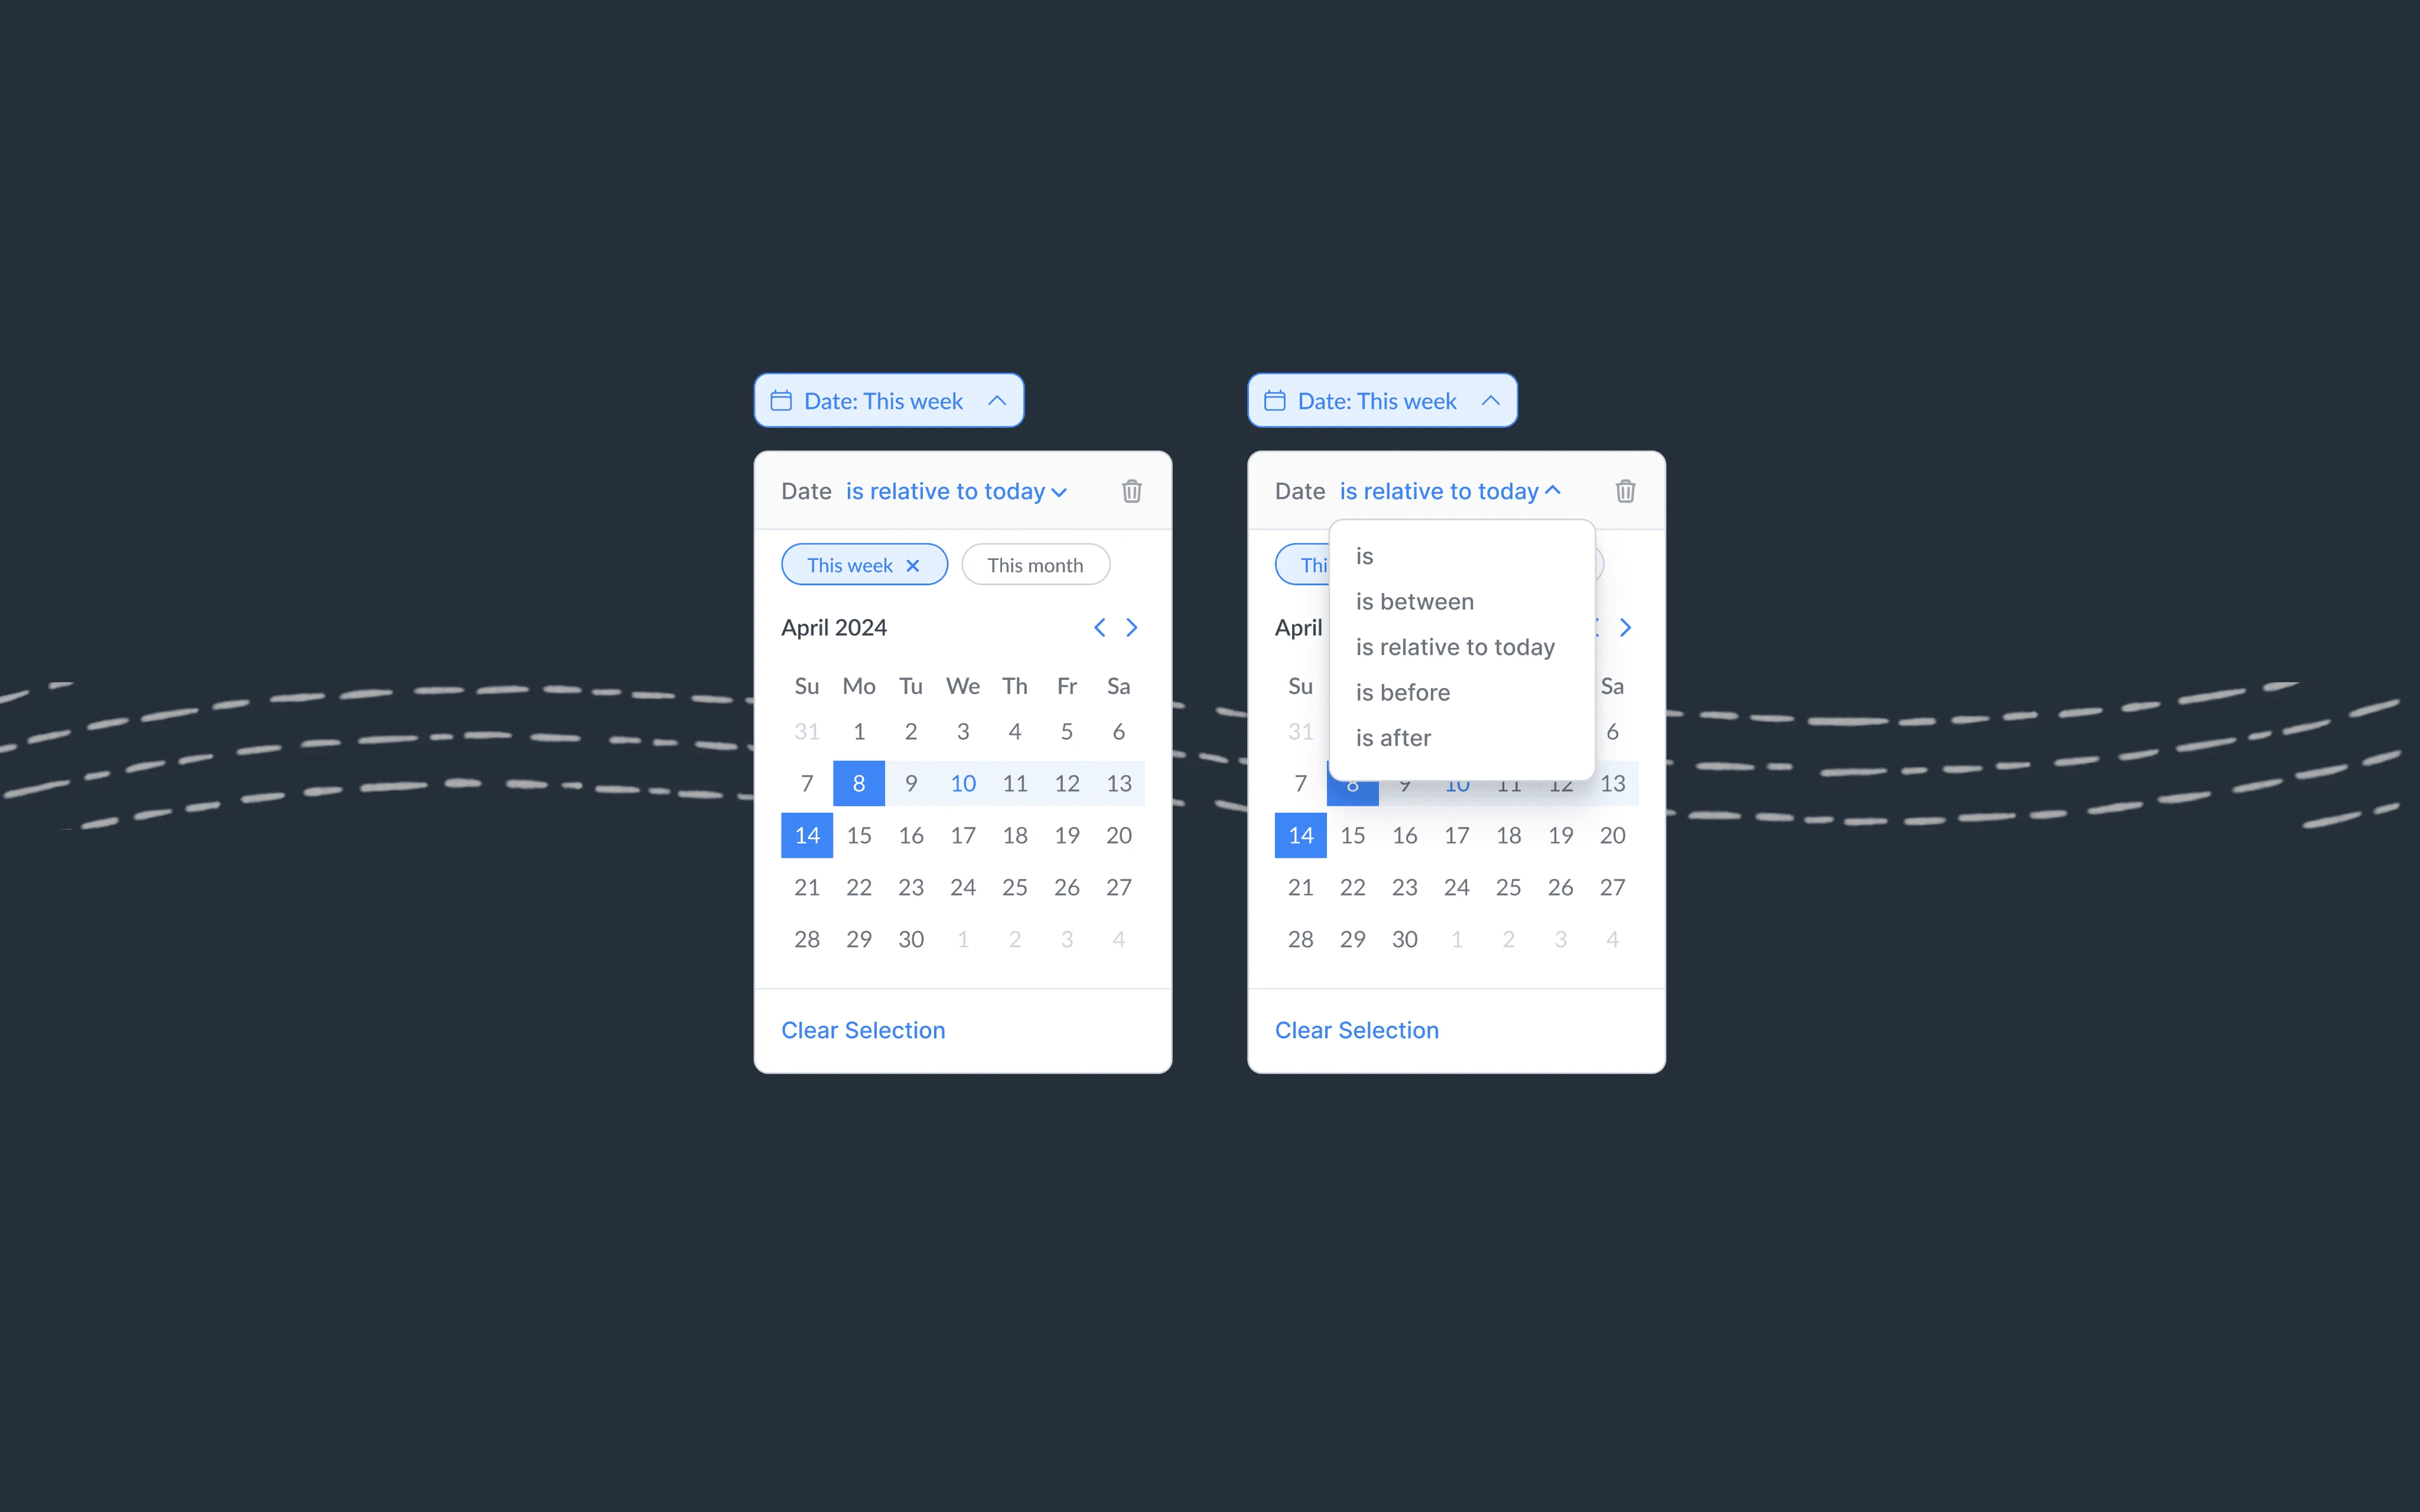
- Versatile Filtering Options:Our dashboard offers a diverse array of filters, empowering users with a wide range of options to refine their data queries according to their unique needs and preferences.
- Tailored Data Retrieval:By leveraging our filtering capabilities, many of our customers have successfully located their specific data points amidst large datasets, streamlining their workflow and enhancing productivity.
Defining Success Metrics
How will we measure our progress toward our goal?
- Error Rates:Track the frequency of errors or incorrect selections made by users while interacting with the filtering interface. Lower error rates indicate better usability and user understanding of how to use the filtering features effectively.
- Click-through Rate (CTR) on Filters:Measure the percentage of clicks on filter options or applications compared to the total number of interactions with the filtering system. A higher CTR indicates effective filter design and user engagement.
- Task Completion Rate:Measure the percentage of users who successfully accomplish their tasks or goals using the filtering system. A higher task completion rate indicates that users can efficiently locate the desired information with the help of filters.
- User Satisfaction Surveys:Gather feedback from users through surveys or interviews to assess their satisfaction levels with the filtering experience. Questions can focus on ease of use, effectiveness in finding specific data, and overall satisfaction with the filtering functionality.
Competitive Analysis

BetterStack
Cons:
- Setting up and understanding BetterStack’s filtering features may take time initially.
- Users need to familiarize themselves with the interface.
Pros:
- Provided filter by specific keywords or patterns.
- BetterStack provides robust filtering capabilities for tables.
- Users can create custom dashboards with filtered data.
DataDog
Cons:
- The interface may feel tricky initially.
- Users need to ensure proper configuration.
Pros:
- Datadog provides filters for applications, databases, servers, and more.
- Users can define custom filters to extract meaningful information.
- Users can use wildcard characters (prefix, suffix, substring) to filter tags.
- Use Boolean operators (AND, OR, NOT) to combine multiple tags in your queries.
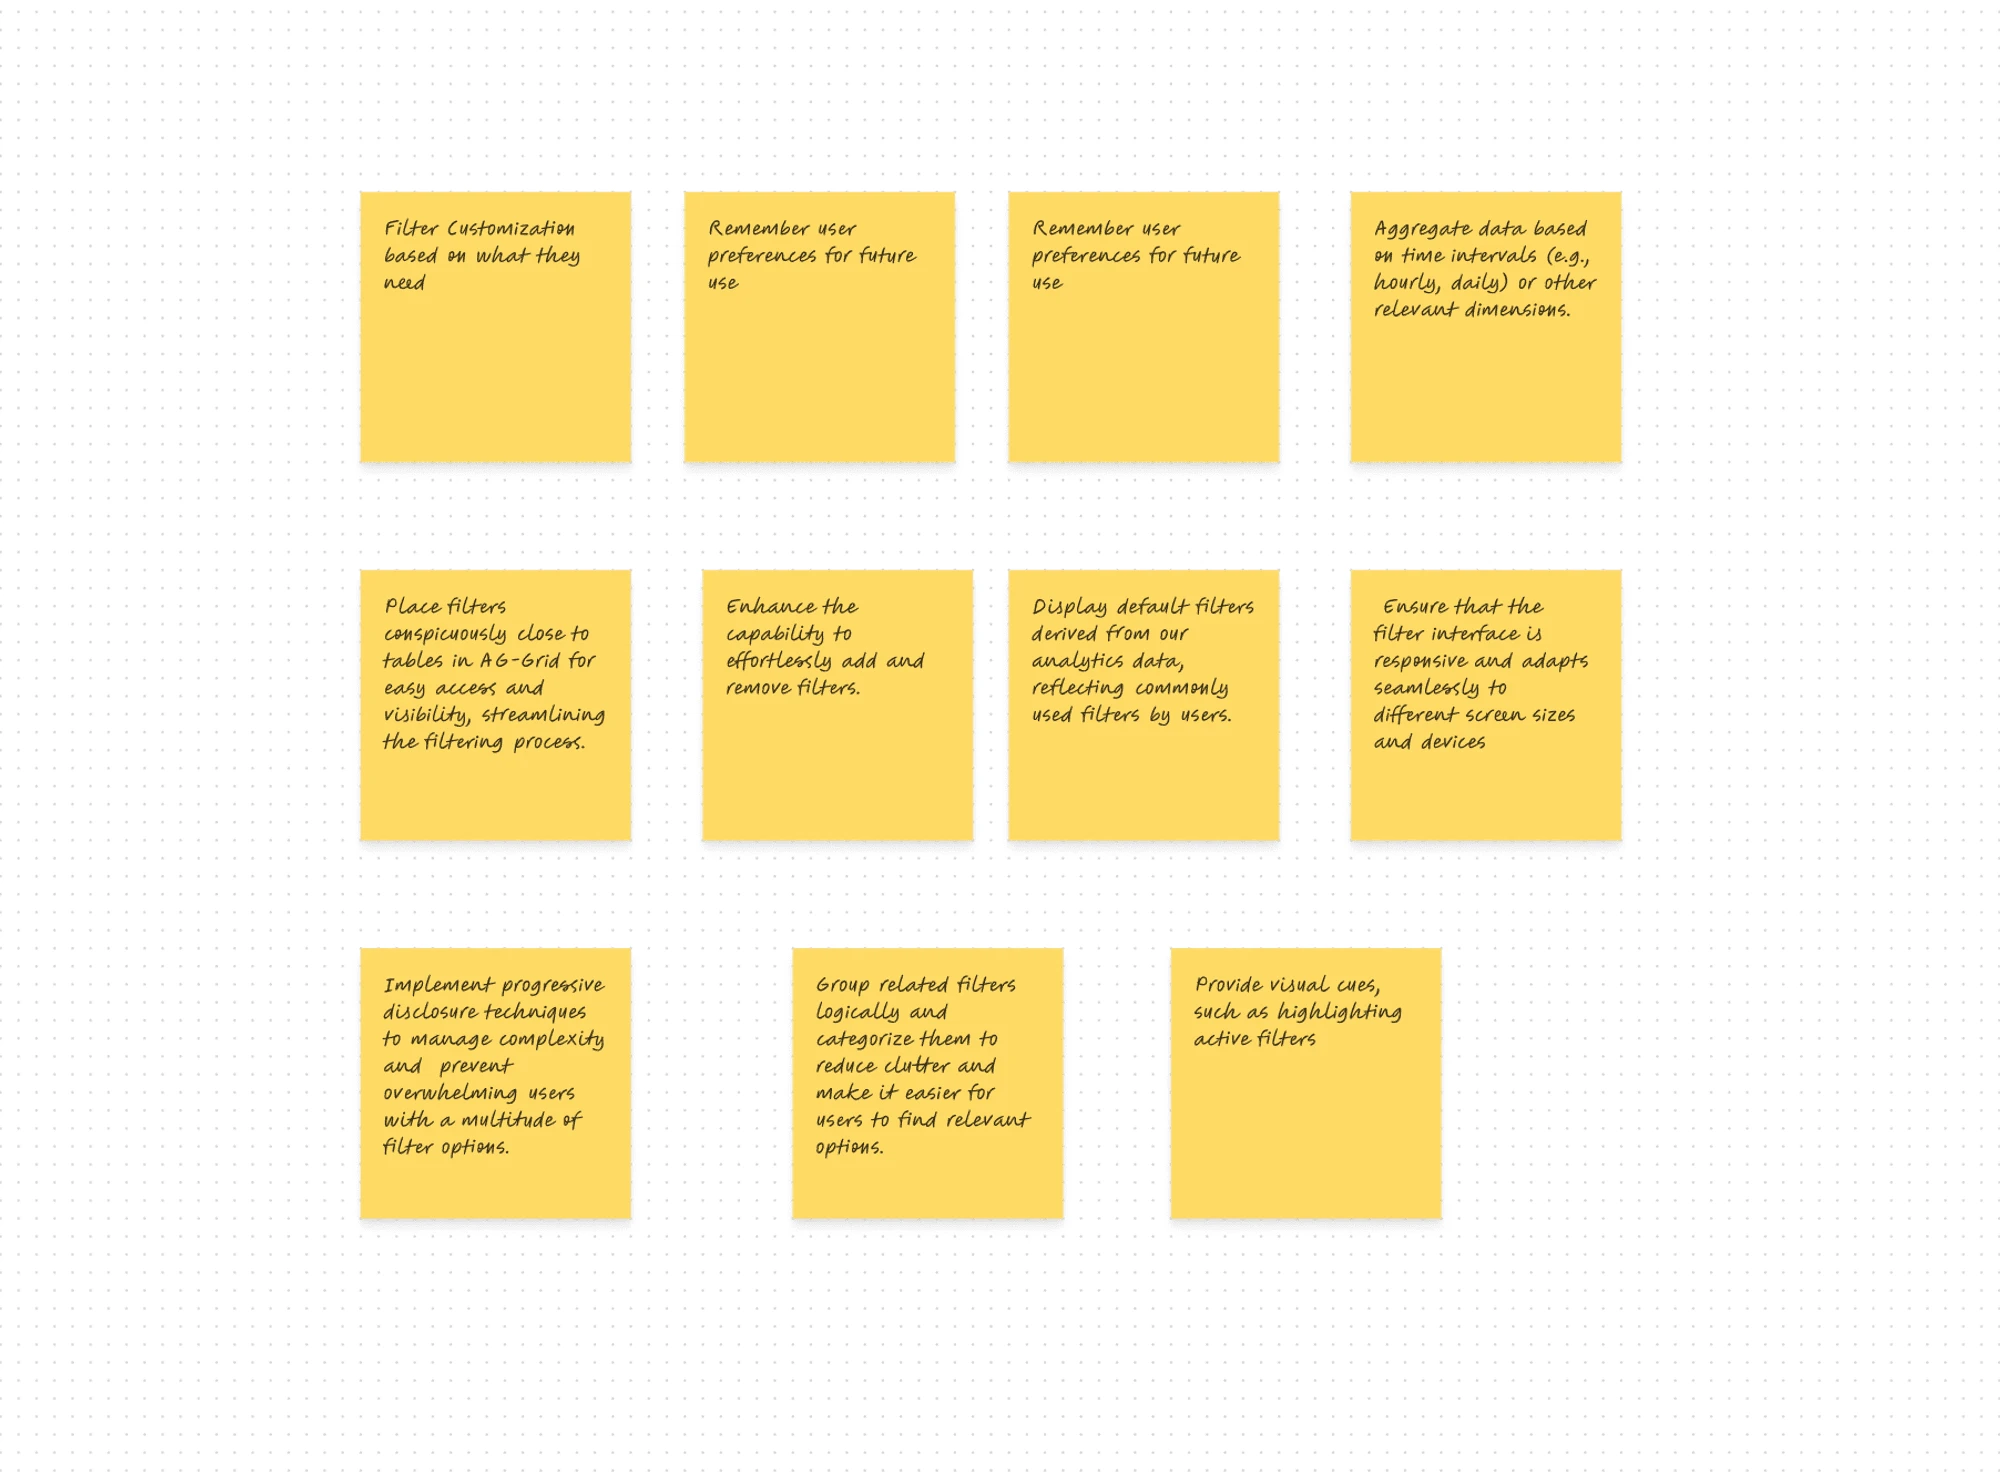
Brain Storming
- All participants wrote their ideas on Post-its.
- After a certain period of time, one person begins to stick his own ideas on a flip chart and explain them. If there is already a similar Post-it, another one is glued next to it.
- During the explanations of the other team members, new ideas are generated (ideation) and written on new Post-its.
- The result is a clustered collection of ideas, which can be later evaluated.
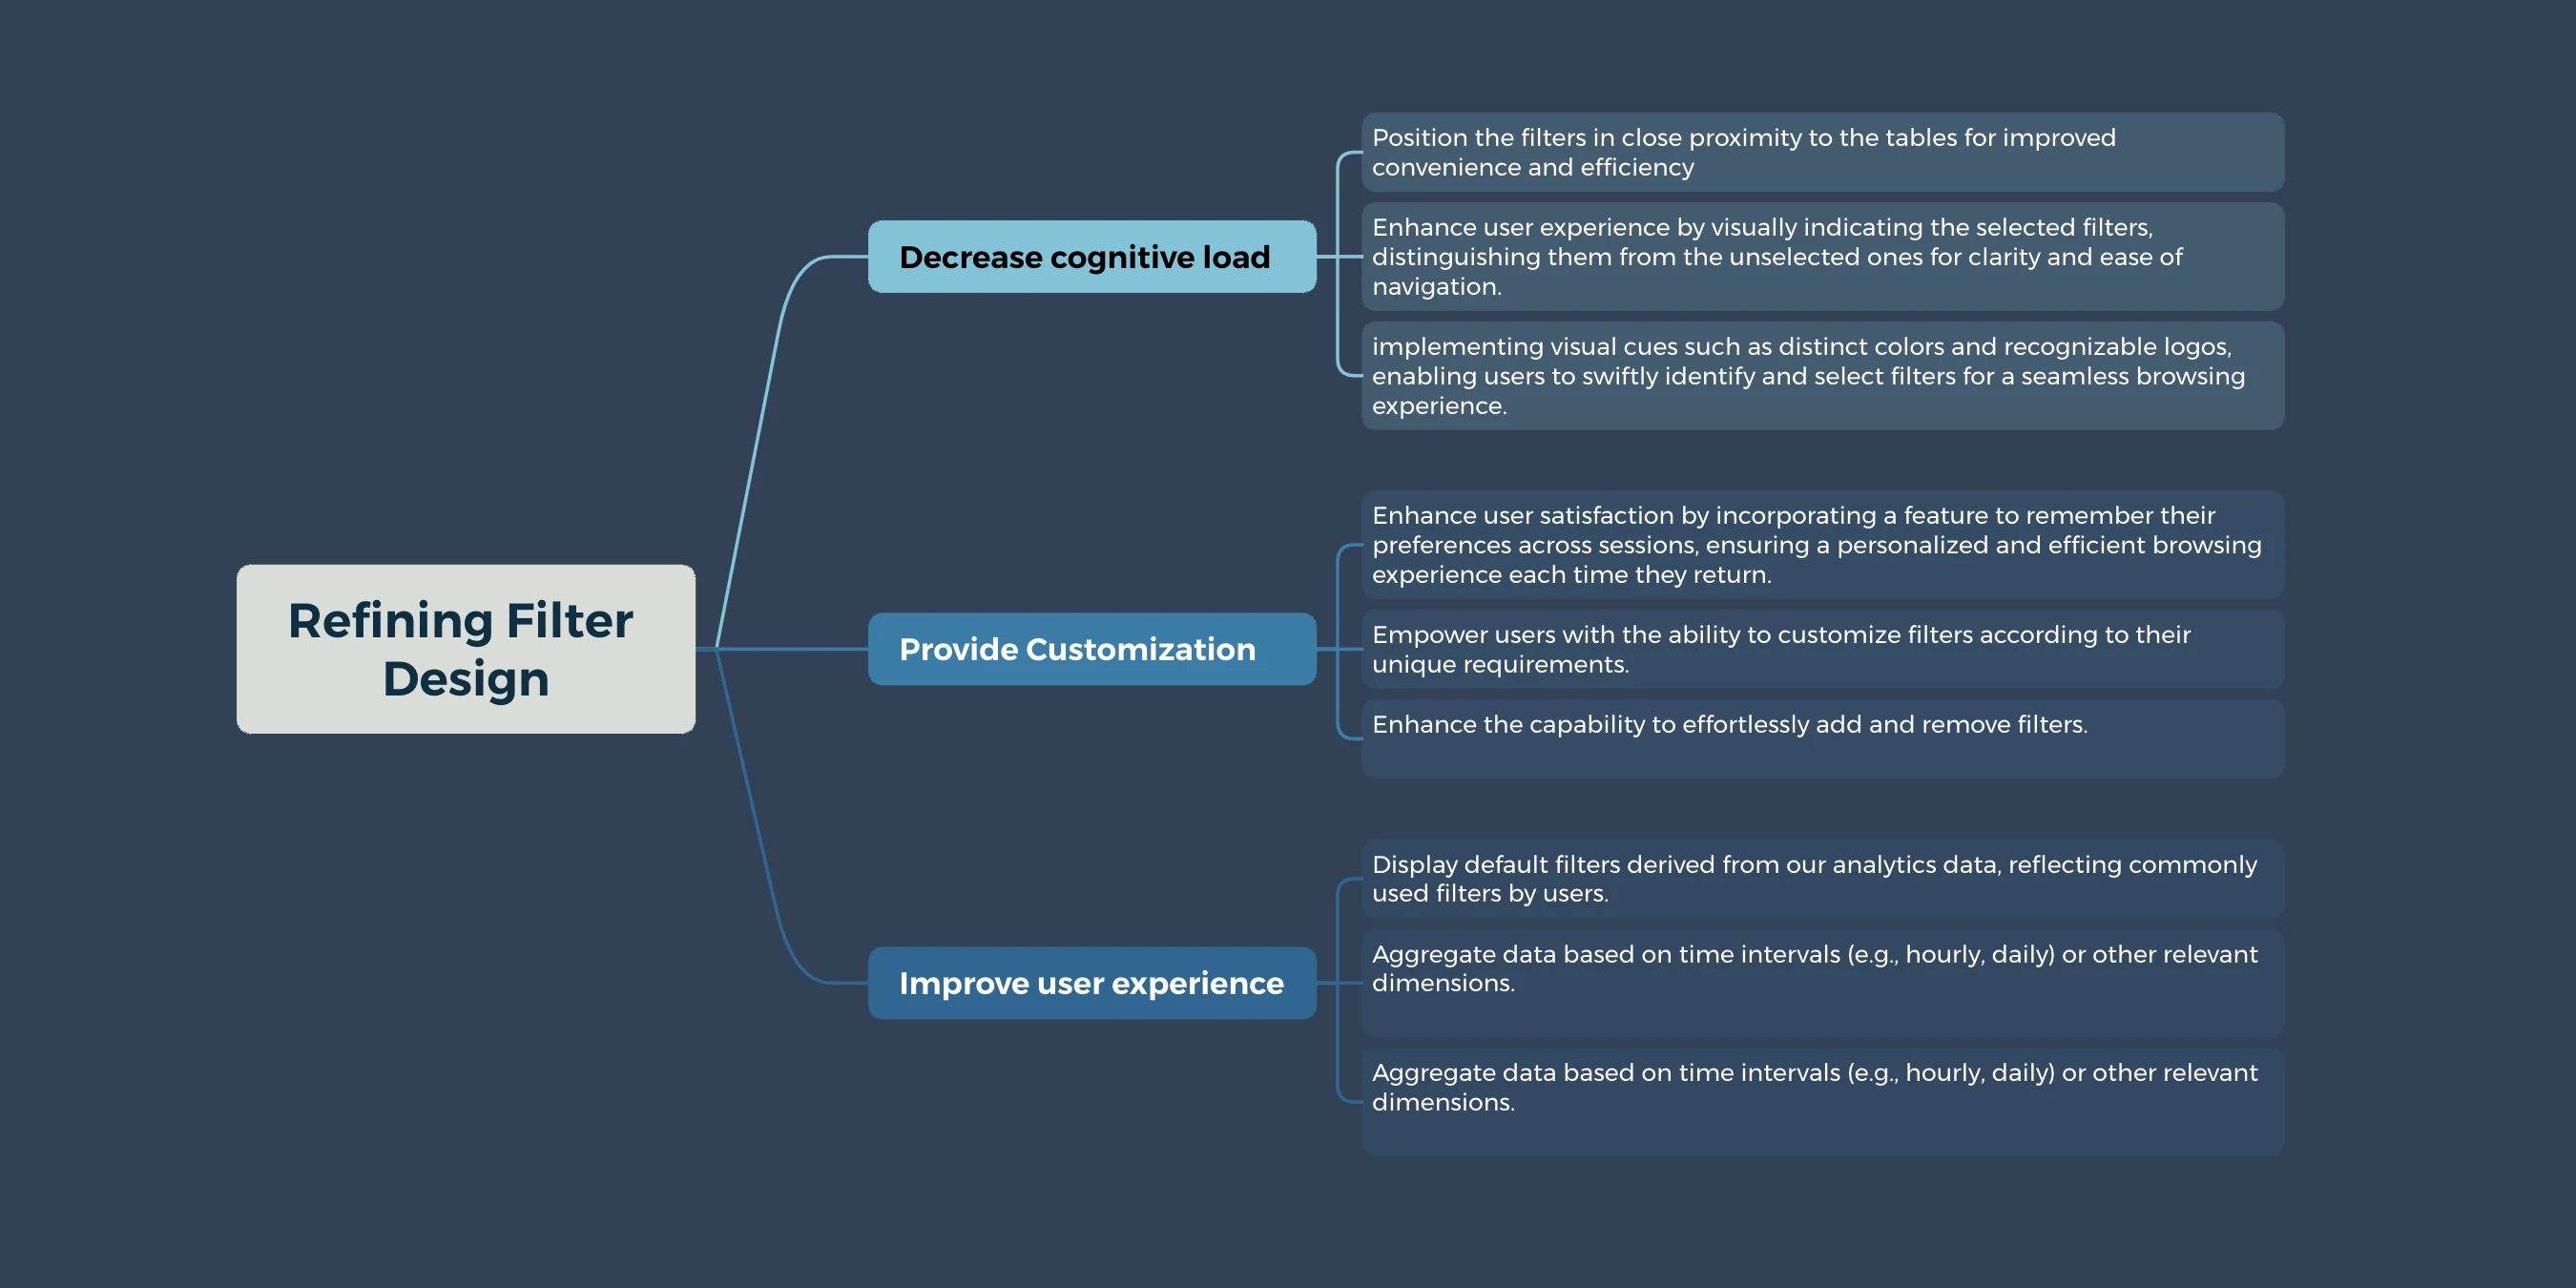
Prioritizing Ideas
Design Iterations